This past week I have technically been without a job, albeit dramatic it is technically true. Whilst I start my new job tomorrow as of the time of writing this, I decided that between jobs I would challenge myself to a small hackathon - as most people do… right?
Anyway the challenge I set myself was one that I have seen asked a few times “Can I use ggplot2 with pipes?”
For those unfamiliar ggplot2 is a fantastic, and basically the primary, plotting library within R; and pipes are a way in which we can chain code together. Both these functionalities are contained within the “tidyverse” - pipes were originally within magrittr which is a separate package but they are integral to the tidyverse - since ggplot2 was created before the bulk of the tidyverse it doesn’t fit quite as well as everything else as it can’t use pipes when building plots.
Having recently spent some time investigating one of the tidyverse packages “purrr” I saw a potential to solve this problem, so I decided this is how I would spend part of my week between employment - the result is ggpipe.
N.B. I came across another github package called “ggpipe” (here)[https://github.com/zeehio/ggpipe] and why I chose to create another is because I thought there was a way to make ggplot pipeable without defining every geom, hopefully meaning it can use the other extensions to ggplot2 although this was not part of the initial build parameters.
By utilising map and other functions within the tidyverse - predominantly group_by - I have been able to create three helper functions that enable ggplot to be piped into existing workflows. Whilst I might have missed some of the more niche functionalities, I believe it provides the core functionality that further integrates ggplot2 within the tidyverse without adding too much additional complexity.
At the moment it requires some manipulation around specifying multiple data and it is dependent upon the data set being grouped for non aesthetic based definitions but I have been able to find workarounds for most of the examples I could think of using. Still room for iteration, but not a bad starting point, as I learn more about “purrr” I know this can be improved.
You can find the package (here)[https://github.com/statisticiansix/ggpipe], and you can see an example below.
library(tidyverse)
devtools::install_github('statisticiansix/ggpipe')
library(ggpipe)
out <- mtcars %>%
group_by(am) %>%
nest('data'=-am)%>%
mutate('test'=map(data,function(data){
data %>%
filter(disp<150)
}))%>%
mutate('colour'=ifelse(am==0,'red','purple'),
'title'=sprintf('AM: %i',am),
'subtitle'=sprintf('Data from %i different models',map_dbl(data,nrow)),
'minlimit'=ifelse(am==0,-1000,-250),
'maxlimit'=map_dbl(data,function(x)max(x$disp)))%>%
ggpipe() %>%
gglayer(geom_point,aes(x=disp,y=hp),colour=colour)%>%
gglayer(geom_point,data=test,aes(x=disp,y=hp),colour='green')%>%
gglayer(scale_x_continuous,limits=c(minlimit,maxlimit))%>%
gglayer(labs,title=title,subtitle=subtitle)%>%
gglayer(facet_wrap,cyl~.)%>%
ggtheme(theme_bw())
out$plot## [[1]]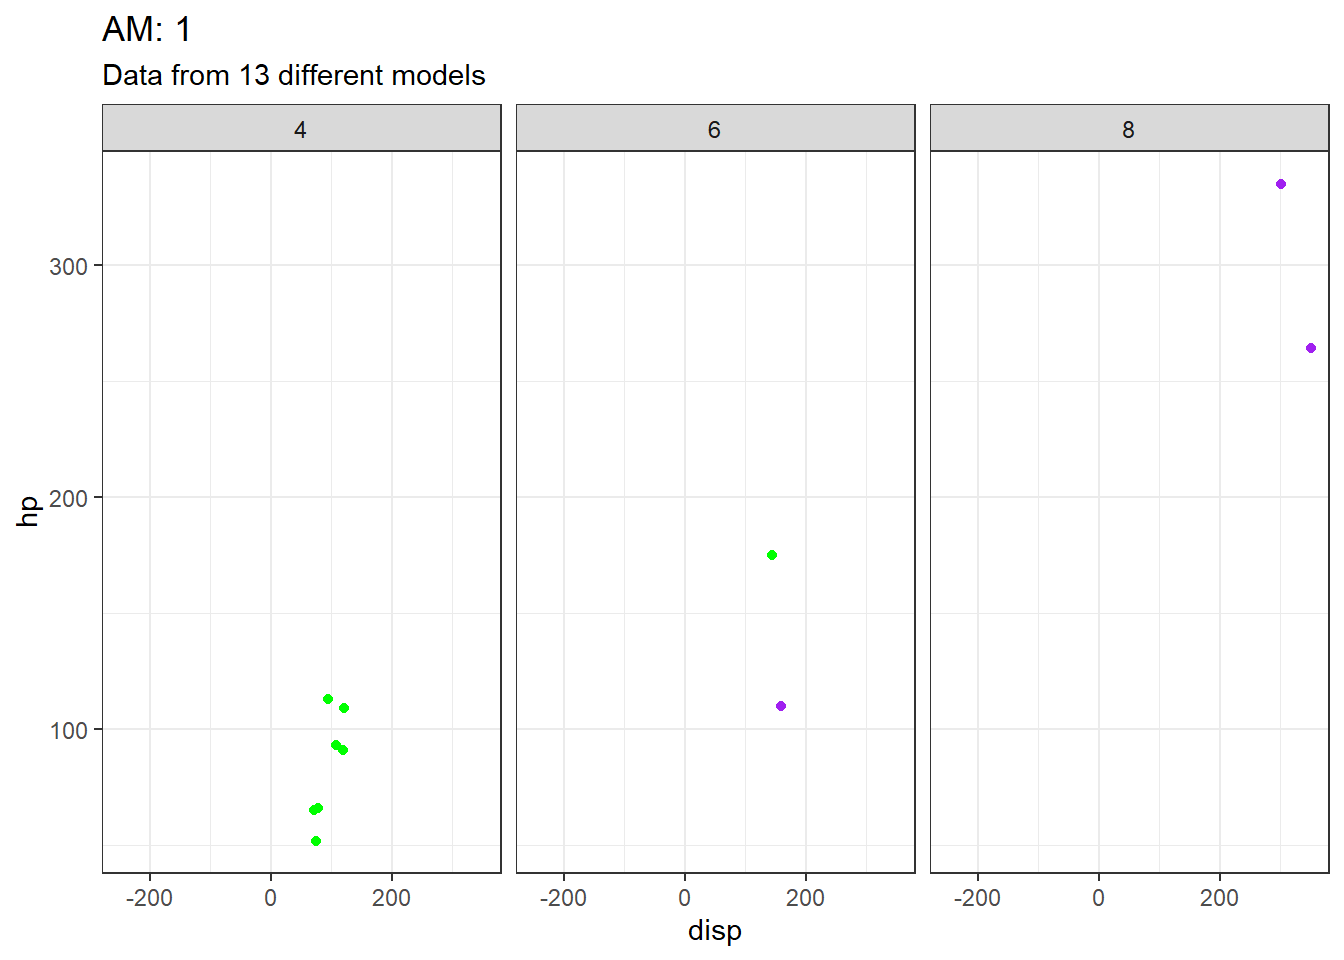
##
## [[2]]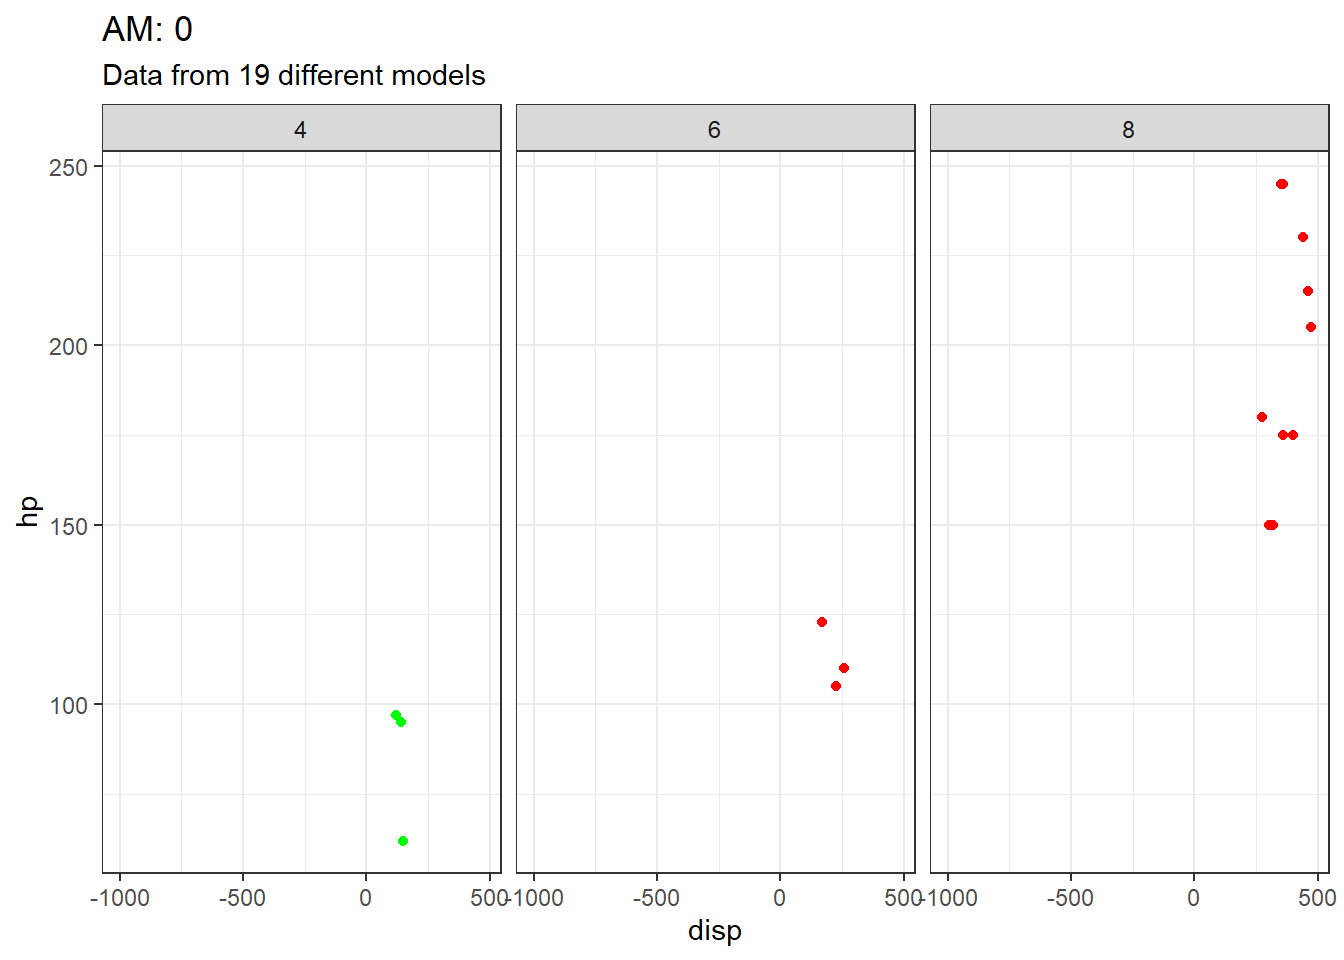

Twitter
Google+
Facebook
Reddit
LinkedIn
StumbleUpon
Email